Genomic Surveillance for Bioattribution and Outbreak Response
The problems of pattern and scale when managing the series of logical events required for a pathogen to emerge and cause a pandemic.

Dr. Tom Inglesby and others at Johns Hopkins Center for Health Security have recently posted a report on U.S. Genomic Surveillance, proposing the U.S. define a national strategy for genomic surveillance, fund genomic surveillance, respect folks’ genomic and medical privacy, and speed up the process of data collection while breaking data siloes across genomic surveillance entities and applications.
I never pass up an opportunity to read what Dr. Inglesby and his team are writing and would recommend it to a friend. To add to their report, I’m inspired to dig up some of my pre-COVID work on exactly this: prioritizing genomic surveillance and understanding what we can and cannot do with this technology.
Three papers I first- or co-authored pre-COVID come to mind:
Taxonomic patterns in the zoonotic potential of mammalian viruses - PMC (Washburne et al. 2018)
Percolation models of pathogen spillover (Washburne et al. 2019)
The problem of scale in the prediction and management of pathogen spillover (Becker, Washburne et al. 2019).
These three papers together underlie some intuition I have about exactly what the tradeoffs and limitations of a national strategy for genomic surveillance, as well as opportunities to focus such strategic deliberation on the most suitable scales of space, time, and phylogenetic or taxonomic breadth of pathogens to maximize the likelihood the funds invested in genomic surveillance yield the benefits desired.
Taxonomic patterns: choosing which pathogens to look for and why
Not all pathogens are equally bad. This much is clear, but no matter how we define “bad” (likely to spillover into humans? transmissibility? infection fatality rate?) the results hold - there are lineages of pathogens that are quite bad, and lineages of pathogens that are not quite bad.
Viral evolution is tricky, with DNA and RNA viruses not evidently sharing any genes that suggests they have a common ancestor, yet we can still think of these viruses meaningfully in terms of lineages, and we can analyze the taxonomic tree of these viruses with tools like phylofactorization (Washburne et al. 2017, Washburne et al. 2019). The word “phylofactorization” is a word I literally made up to describe a method developed for this type of analysis. One can intuit the method by analyzing the word: “phylo” = tree, “factorization” = decomposing, or breaking it into parts.
Trees are useful mathematical structures in biology. Trees can be strictly bifurcating lineages that speciate into two daughter lineages, or trees they may have unresolved branches called “polytomies” where one lineage led to 3 or more daughter lineages and we don’t know the order they split off. Taxonomies are often thought of as naming conventions - Domain: Eukarya, Kingdom: Animalia, Phylum: Chordata, … but taxonomic naming conventions and related tools also represent a tree, as the lineage “Domain: Eukarya” branches into many Kingdoms (animals, plants, fungi, …) and then the subsequent Kingdoms all branch into many Phyla, and so on.
Viral evolution may be tricky, but we neatly (and accurately) like to organize viruses based on taxonomies. Viruses come in orders (e.g. the Order Nidovirales), families (Papillomaviridae, Herpesviridae, Adenoviridae, …), genera (Parvovirus, Alphavirus, …) and so on. There are occasionally suborders, subfamilies, subgenera, and even subspecies, but these don’t change the fact that that all viruses can be organized in a tree. If you create the taxonomic tree of viruses and put variables on the tips of the tree corresponding to each virus (e.g. whether/not the virus is known to spillover between over more than one species of mammal), you can then analyze the tree with phylofactorization, yielding high-risk and low-risk lineages.
Below, for example, is the phylofactorization of the ICTV taxonomy tree for viruses based on whether/not they are believed to be zoonotic. The tree is arranged in a circle with one massive polytomy indicating the many orders of viruses radiating from a common classification as “virus”. Colored blocks on the left show lineages of various phylogenetic and taxonomic depths corresponding to some expected probability that a randomly drawn virus from that lineage spills over between mammals (based on our knowledge).
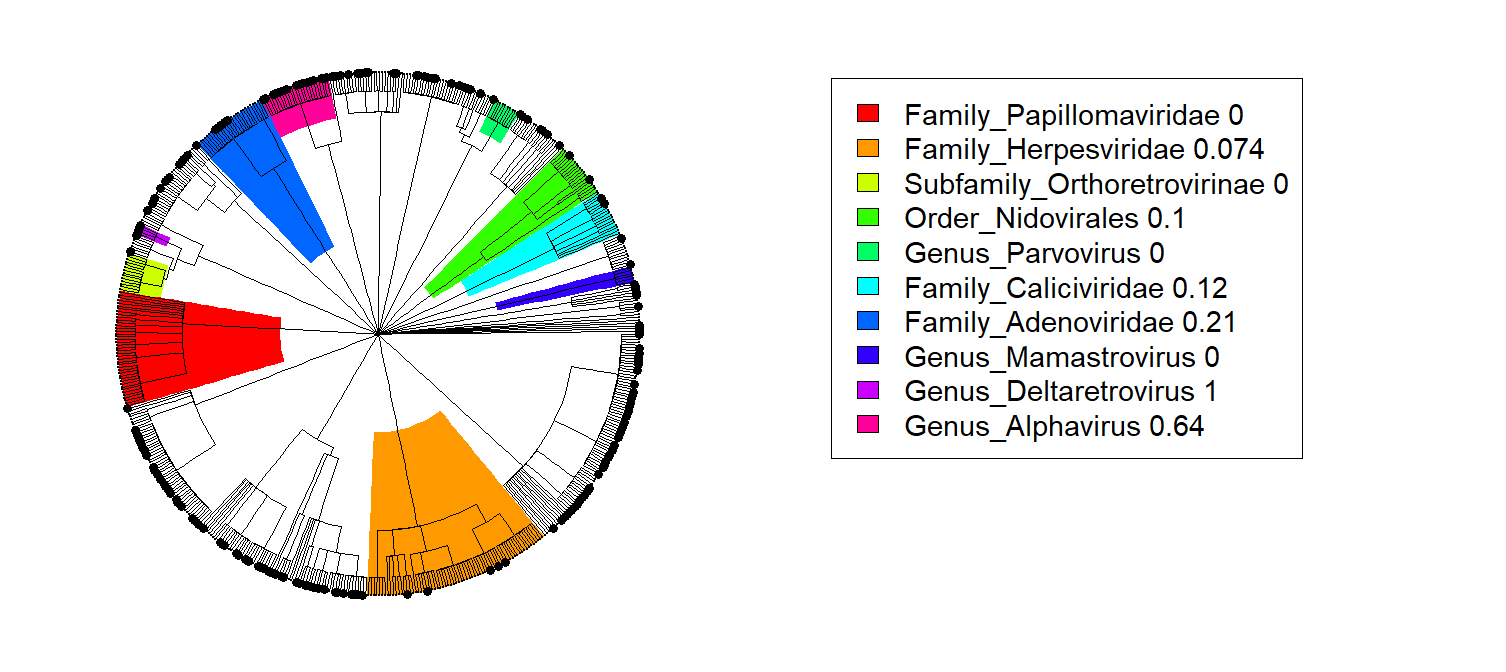
Thankfully, sexually transmitted viral lineages like Papillomaviridae and Herpesviridae don’t appear to spillover frequently across mammals (thank not just our parents, but all our mammalian cousins for their restraint that keeps STDs from jumping the species barrier).
On the other hand, some vector-borne viruses like Alphaviruses tend to have a much higher rate of being found across mammals. This shouldn’t be too surprising as vector-borne diseases often don’t get to decide whose blood they’re going to enter next, they just have to make do with what they’ve got. From an evolutionary perspective, vector-borne diseases that generalize across the same breadth of hosts as the ticks or mosquitoes they inhabit will be more likely to complete their life cycle, thus there’s a fitness advantage to matching the generalist patterns of their vectors.
This paper comes to mind because (1) many viruses don’t need to be monitored from a One Health perspective, (2) those that do can be arranged into a small set of lineages that stand out, objectively, based on statistical analyses, and (3) when we ID a lineage of viruses that we want to surveil, we can usually design genetic surveillance tools, like primers for PCR tests, thus simplifying the logistics of genetic surveillance for pathogens that we think are “bad” (based on whatever numbers policymakers want to put on the tips of the tree).
Percolation models of pathogen spillover: how to not play whack-a-mole
“A series of logical events must occur for a pathogen to spillover from animals to people”. This is one of my favorite lines of any paper I’ve written, as it captures a simple set of assumptions that can lead one to fruitful models of pathogen spillover.
Some processes and systems in nature are governed by regular-enough laws and known causal mechanisms that we can model the time-evolution of the processes and systems, turning today’s data into reasonable forecasts of the future. Weather, for example, might be chaotic and unpredictable more than 2 weeks out, but we can still set up sensors today, measure weather today, and get forecasts of rain a week from now. That is amazing.
We can’t really do that for pathogen emergence. The statistical futility came to light as I analyzed the math behind that italicized phrase above.
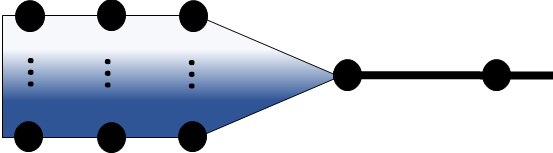
We can represent “a series of logical events” as a path with a series of gates. Below, the lines are the paths and the gates are represented as circles (these shapes correspond to edges and nodes in networks, useful as we see later).

Imagine an infectious particle, such as the original Ebola viruses that infected patient zero and sparked today’s DRC Ebola outbreak. Those viruses came from somewhere, I hope some sort of wild host and not a lab, and as those viruses were in the wild host they travelled down the path on the far left side of the path below. They reached a gate: environmental persistence. In order to move closer to spillover, the viruses needed to persist in the fluids of their host long enough to contact the first human host. After contacting the first human host, the viruses then encounter another gate: receptor binding. The viruses must bind onto the host cell in order to have a shot at getting in. After that, another gate: cell entry. The furin cleavage site of SARS-CoV-2 famously enabled cell entry, as proposed in the 2018 DEFUSE grant, and thus this logical gate on the path to emergence may have been opened in part thanks to the insights of virologists modifying bat SARS-related coronaviruses in Wuhan.
“A series of logical events must occur for a pathogen to spillover from animals to people.”
This series of logical events can be represented as a path, also more formally called a directed graph, and infectious units percolate through these logical gates.
The data we collect for genomic surveillance usually corresponds to key edges or nodes in this path. For example, if we measure receptor binding in an emergent virus or family (or genus or subfamily or whatever) of viruses, that reduces our uncertainty about one gate in the path to spillover for these viruses. Similarly, when we conduct environmental surveillance, we can get an estimate of the load of infectious units out there in the world getting at least to the beginning of the path. When we measure patients who are sick, we are measuring the very last gate, a gate beyond human infection even, beyond the gate of a patient being sick-enough to seek care, but the gate near the end of a patient being sick enough to seek care and a doctor ordering the test.
The data we analyze in epidemiology connects to these directed graphs. We can also be more clever with graphs for pathogens that come from multiple sources:
or even graphs of infectious units released over some continuous variable like time or space:
These graphs can help us formalize the “series of logical events” we’re thinking about, point out where we have data, where we have justifiable assumptions, and where just don’t know what we need to know about the logical gates. As a quick note, forecasting involves collecting data to predict the movement of infectious units forwards in these graphs, while bioattribution is the inverse problem of finding out which of the many branches ultimately caused a specific biological event. The math is more or less the same, and in another life I’d probably publish why this math says SARS-CoV-2 definitely came from a lab (e.g. one of the branches above is the Wuhan Institute of Virology, other branches correspond to bats, raccoon dogs, pangolins, or whatever other innocent creatures folk hypothesize could have caused a natural spillover).
We can also split up the variance of how people get sick into “manageable variance” - the gates we can close - and “unmanageable variance” - the things we just can’t do shit about. Crucially, sometimes interventions can reduce the likelihood an infectious unit passes one gate, but it could increase the likelihood an infectious unit passes another, as below.
Here’s why this old paper of mine is still relevant for post-COVID genomic surveillance (pre-COVID still feels like 2 generations go): all epidemiological surveillance collects data somewhere on this graph, providing information and reducing uncertainty on some small but important logical gate or the path we can monitor.
Some people argue that pathogens coming from multiple hosts would be too expensive to surveil at the branched left-hand-side of this graph, where dozens of species of bats or rats or whatever else would need to be monitored, and even then it’s not clear that information would provide much value since it’s so far from the right-hand-side of the graph where bad things happen to people.
Some also consider vaccinating wildlife to prevent spillover. We proposed that, in fact, in the DARPA PREEMPT team I worked with and whose proposal I co-authored pre-COVID. However, we proposed that for a subset of viruses where the host range is very small, meaning we won’t have to play whack-a-mole vaccinating every obscure species of mammal out there, but instead if we could immunize flying foxes in a region, especially those with a high risk of bat-human (or bat-horse, or bat-date-palm-sap-bucket overlap) then we could plausibly preempt pathogen spillover.
I found the graphs above extremely useful to formalize the problem we’re trying to solve with surveillance. Our data informs one piece, and our management opens or closes one gate, so we should think carefully about which piece of that graph we want to monitor and how that ideally improves the manageable variance by informing which gate we can close.
Without getting into the math, however, forecasting pathogen spillover in a rapidly changing world seems quite impossible to me. That doesn’t stop people from doing it, projecting lines through the equivalent of two data points over two days to predict where rain drops will fall down to the millisecond 2 years from now. It just means I don’t buy those results at all. I would not bet my money on them because the nature of this “logical gate” system is that a subtle change in one gate, perhaps a gate whose opening/closing varies based on a variable that’s changing over time, can be invisible to our models if our data is too far downstream. These variables are known to be important, but when and how steeply they become important is hard to forecast.
The problem of pattern and scale in genomic surveillance:
My PhD advisor, Simon Levin, wrote my favorite science article of all time: the problem of pattern and scale in ecology. I re-read that article at least once a year. I love it, it simplifies one of the most complicated systems in the universe with intuitive language that connects directly to very real mathematical choices and models.
Some patterns - such as the likelihood of rainfall - may be predictable on some scales but not others. For example, we can predict the likelihood of rainfall over the timescale of a few days and the spatial scale of a hectare (or so). We can’t predict the likelihood of rainfall 2 months from now, nor can we predict very accurately the likelihood of rainfall over a square centimeter. We can, however, predict the likelihood of rainfall again over the annual and multi-year timescale, even decades into the future, thanks to the regularity of climates and the slow but predictable change of climates.
Pattern.
Patterns are things theoreticians always think about - it’s the forest we see instead of the trees, the regularity, the similarity. The “taxonomic patterns of pathogen spillover”, for example, notices some regularity in which lineages of viruses are more likely to spillover. If SARS-CoV-2 was the only lab-caused pandemic in the world, there’d be no need to focus on biosafety, but instead it is a pattern. SARS-CoV-1 spilled over in lab accidents several times, all in China, all before SARS-CoV-2 emerged. Ebola. We don’t talk about Lloviu or Marburg much as these cousins of ebolavirus don’t cause as worrisome of outbreaks as ebola does, and the pattern of ebola emergence is clear: it’s always in Africa. By noticing patterns, we can evaluate competing theories about the patterns, learn the underlying causal mechanisms, and plausibly better manage these systems, preventing lab accidents capable of causing a pandemic, preventing ebolavirus from killing thousands (or, worst case scenario, escaping Africa), and more.
Scale.
Time. Space. Phylogenetic breadth. Do we want to predict things tomorrow, next month, next year, or 10 years from now? Do we care just about the humans closest to our network, the population in the US, or the global human population? Do we focus on all viruses and pathogens everywhere, or to we surgically focus on phylogenetic scales that have some “manageable variance” and/or for which we can collect actionable data somewhere on their logical path to spillover and emergence?
The problem of pattern and scale in ecology has, as a special case, the problem of pattern and scale of pathogen spillover. The forecasts we make concern some scale of space (e.g. Brazil) and time (e.g. annual) and phylogenetic breadth (pathogens that present in humans like malaria, or malaria sequences in mosquitoes, or malaria sequences in some phylogenetically defined set of hosts).
If we want to manage the variance of these systems, we have to zoom out to the appropriate scale at which patterns emerge and evaluate genomic surveillance in the context of existing management tools to assess whether or not we’ve got a shot at reducing disease burden with the proposed information stream informing the proposed actions and responses to information to manage that variance.
Put simply, we need to prioritize the most predictable patterns at the most actionable scales, and get data to make predictions and inform actions.
What all this means
I love genomic surveillance as much as the next data analyst. However, there’s such a thing as useless data. If someone were screening Papillomaviridae across mammals and saying this would prevent the next Papillomavirus pandemic, I’d chuckle. I’d chuckle even more if they were surveilling some weird fish virus, cricket virus, or whatever - the path for such viruses to percolate through logical gates and spillover into humans is all but closed. The taxonomic patterns of which viruses are “bad” connect with the models for patterns of how these pathogens make their badness known, namely by infecting people who become documented cases.
Many microbes transmit from human-to-human without causing severe-enough symptoms for the patient to seek care, get tested, and get diagnosed. In fact, most microbes fall in this category - this is what got me interested in “microbiome” research for one chapter of my career, as the human microbiome tells the story of microbes using humans as a vibrant island the same way Darwin’s finches and blue-footed boobies use the Galapagos islands. Some microbes stay put in the host and evolve to fit that environment, others spread their little microbial wings and fly between hosts, maybe not just humans but even to dogs, cats, and other animals we come in contact with either directly or indirectly through environmental exposure.
Implicit in genomic surveillance for biodefense and biosecurity is a focus on the bad guys, the microbes that disrupt host functions enough to cause harm, reducing agricultural yields, weakening immune systems, making people call in sick or warfighters be less prepared for battle, or even killing people.
The first step for national strategy is to define “bad”. From there, we have tools to simplify the problem by focusing on taxonomic patterns of who’s bad and who’s not. Then, we can focus on the life cycles of each of those bad guys, look at the percolation model of how they enter the human population (or ag/vet populations) and cause harm, and evaluate the actions.
I sometimes like to work backwards on the percolation models above. Start with the set of actions you’re willing to take, then let’s see if there’s any data that can make those actions more effective. If you’re willing to drive species extinct (I’m not) then you can just eradicate bats to get rid of bat-borne viruses, easy as that. If you’re not okay prohibiting hunting, then you’ll need to mitigate the human-animal contact of bodily fluids during hunting by education, maybe providing kits to dress animals, and possibly testing animals before the hunter eats them in case that can save them. If you’re okay slowing down grant approvals, then you can reduce biosecurity risks by adding an additional gate capable of closing the construction of more-infectious or more-lethal pathogens in the lab, reducing the likelihood such lab-originating viruses enter the human population (you can also reduce lab worker exposure risks, monitor lab workers, and populate data downstream of the gate where the more-infectious pathogen has been created).
Genomic surveillance is good, especially when it’s guiding specific actions, especially when those actions are chosen based on a deliberate national strategic choice of what is “bad”. Once you define “bad”, and outline the set of actions you’re willing to take along the series of logical events required for the bad thing to happen, then we can start talking about which data, if any, can inform actions in time to prevent the bad things from happening.
I’d like to express my sincere thanks again to the Johns Hopkins team for putting together their report. If anybody wants to chat more about this with me, you’ll find me in the mountains, drinking straight out of streams (trying to mitigate risk by choosing streams wisely), hunting deer that may well have chronic wasting disease, dusting out a garage full of mouse crap that could very well have hantavirus, romping through woods full of ticks known to carry the bubonic plague in a hotspot of plague in North America, all while thinking about which data is useful, and which data is useless.